
Summary
In the wake of a pandemic and deep recession, this third Faces of Unemployment report examines the profile of people affected by unemployment – those relying on the $45 a day JobSeeker Payment and even lower Youth Allowance.
It looks behind the headline unemployment statistics to reveal that long-term unemployment – as measured by reliance on unemployment payments for over 12 months – is now entrenched at an economically and socially harmful level. It examines trends in entry-level jobs and ‘mismatch’ in the labour market, showing that it’s no easy matter for people who are unemployed to secure paid work despite growth in job vacancies. We also look at the assistance provided to people by jobactive employment services and what should be done to improve the employment prospects of people unemployed long-term.
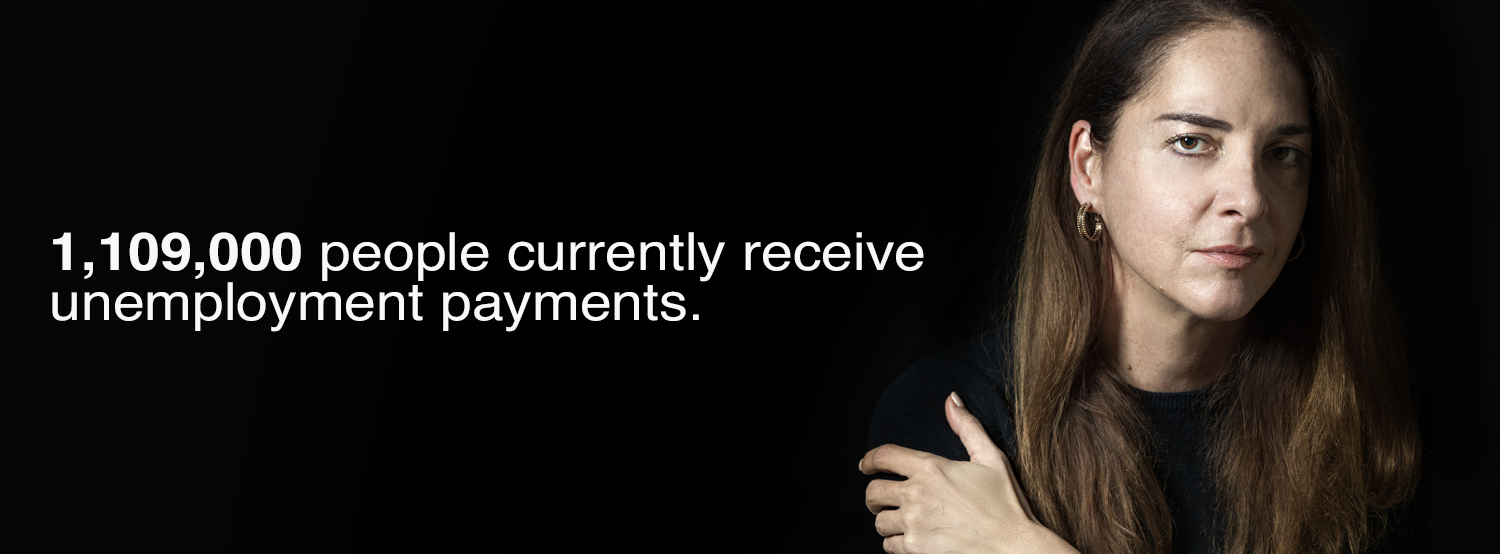
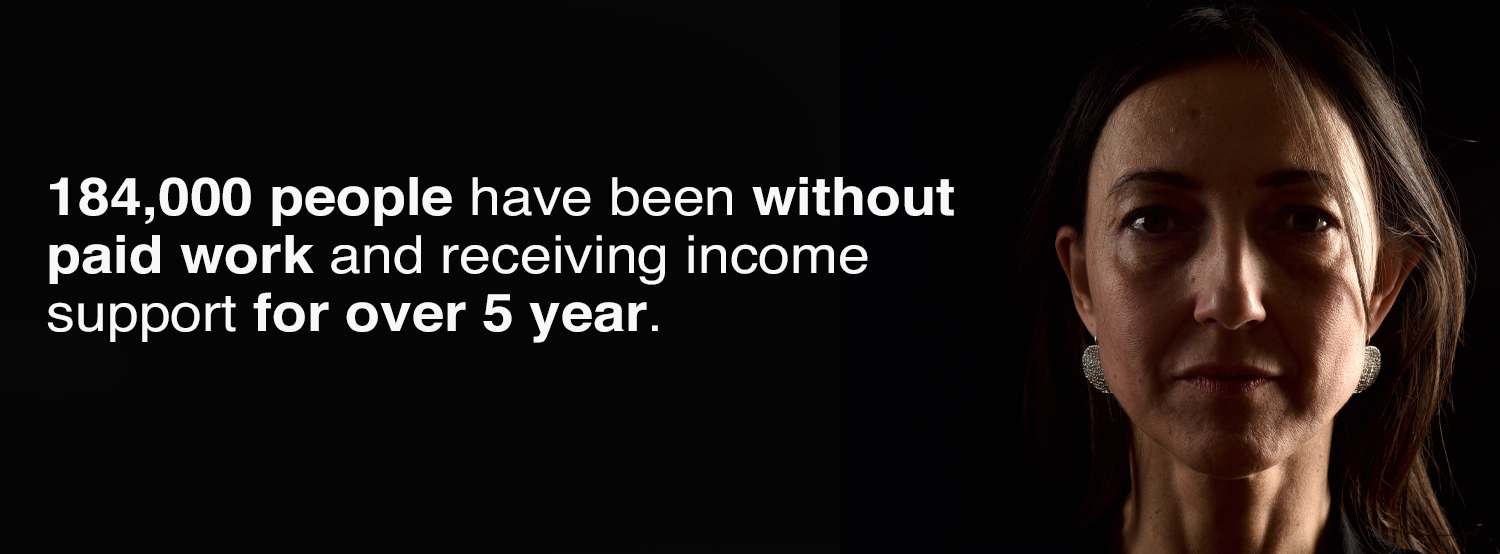
Despite labour shortages in some industries coming out of lockdowns, it’s not easy for people who are unemployed to pick up a job It is no simple matter for people on unemployment payments to find jobs as we emerge from lockdowns and the deepest recession in almost a century: Businesses and jobs do not instantly ‘snap back’ when lockdowns are lifted. The jobs created and restored aren’t always suitable for the people who are searching for employment. They may not live where the jobs are located; they may not have the skills required; and many will be understandably fearful of taking on public-facing jobs due to COVID-19. This ‘mismatch’ problem is worse than usual due to the ‘churn’ in the labour market caused by repeated lockdowns and border closures, which means that vacancies have increased faster than ongoing jobs. Over 800,000 people unemployed long-term are stuck at the back of the jobs queue on unemployment payments of $45 a day As jobs have returned after lockdowns, most have been filled by people who became unemployed relatively recently, leaving those more disadvantaged at the end of a much longer queue. There are 1,109,000 people currently receiving unemployment payments, 31% more than before the pandemic, of whom: Despite concerns about labour shortages, many employers are still reluctant to employ older people, people with disability and those who haven’t had experience of paid work for a long time. New data reveals that 184,000 people have been without paid work and receiving income support for over 5 years The majority of people in this highly disadvantaged group (65% or 119,000 people) have a disability. They are on unemployment payments because successive governments have made it harder to obtain Disability Support Pensions, diverting them instead to unemployment payments which are $165 per week lower. Yet the employment prospects of this group are clearly very limited. Also prominent in this highly disadvantaged group are 72,000 people (30%) aged 55 years or over. Successive government policies have shifted older workers onto unemployment payments, especially women aged 60 years or more who previously received the Age Pension. This explains why 55% of those on unemployment payments who have received income support for five years or more are women. These policy changes have been made without effectively tackling age discrimination in the labour market, which remains stubbornly entrenched. Other groups prominent among those on unemployment payments who have received income support for five years or more are: Secure entry-level jobs are declining The pandemic accelerated the long-term decline in entry-level jobs, which are increasingly offered on a part-time and casual basis only: While jobs in many of these sectors will increase with the reopening of the economy, many will be filled by people on temporary visas once international borders re-open. Many employers are likely to revert to over-reliance on temporary visa holders to fill positions in hospitality, retail and horticulture, under poorly regulated conditions where under-payment is widespread. Budget and interest rate policies that give priority to full employment will help, but aren’t enough on their own to reduce prolonged unemployment The government and Reserve Bank’s shared commitment not to tighten budget and interest rate policies until we reach full employment will help reduce unemployment, provided they target an unemployment rate consistently below 4%. Yet this will not be enough to reduce long-term unemployment: This stark policy failure is partly due to ‘welfare to work’ policies that shifted people with disabilities, parents and older people onto unemployment payments without investing in the supports they need to secure employment. Employment services are under-funded and too focused on ‘tick-a-box’ enforcement of mutual obligations Australia under-invests in effective employment assistance for people unemployed long-term, especially paid work experience in regular jobs, foundational and vocational training, and local partnerships (between employment and community services, training colleges and employers) to prepare and connect them with the right jobs. Australia spends less than half the OECD average level on employment services, or just $1,600 per person receiving jobactive services. As the government’s Expert Advisory Panel on employment services found, employment services have excessive caseloads (over 140 per consultant) and those very limited resources are mainly devoted to enforcing ‘tick-a-box’ compliance with unrealistic and ineffective ‘mutual obligation’ requirements such as applying for 20 jobs a month and participating in Work for the Dole. The resulting rise in semi-automated payment suspensions (over 750,000 payment suspensions were imposed as mutual obligations were restored in the first three months of 2021) causes distress and hardship for many. The government’s recent decision to hastily restore full mutual obligations, payment suspensions and penalties as soon as 80% vaccination targets are reached in Sydney, Canberra, Melbourne and elsewhere exacerbates this, putting people’s physical and mental health at risk. ACOSS advocates a four-pronged strategy to ease poverty among people who are unemployed and improve the employment prospects of the most disadvantaged:
Policies to reduce poverty and long-term unemployment
Part 1
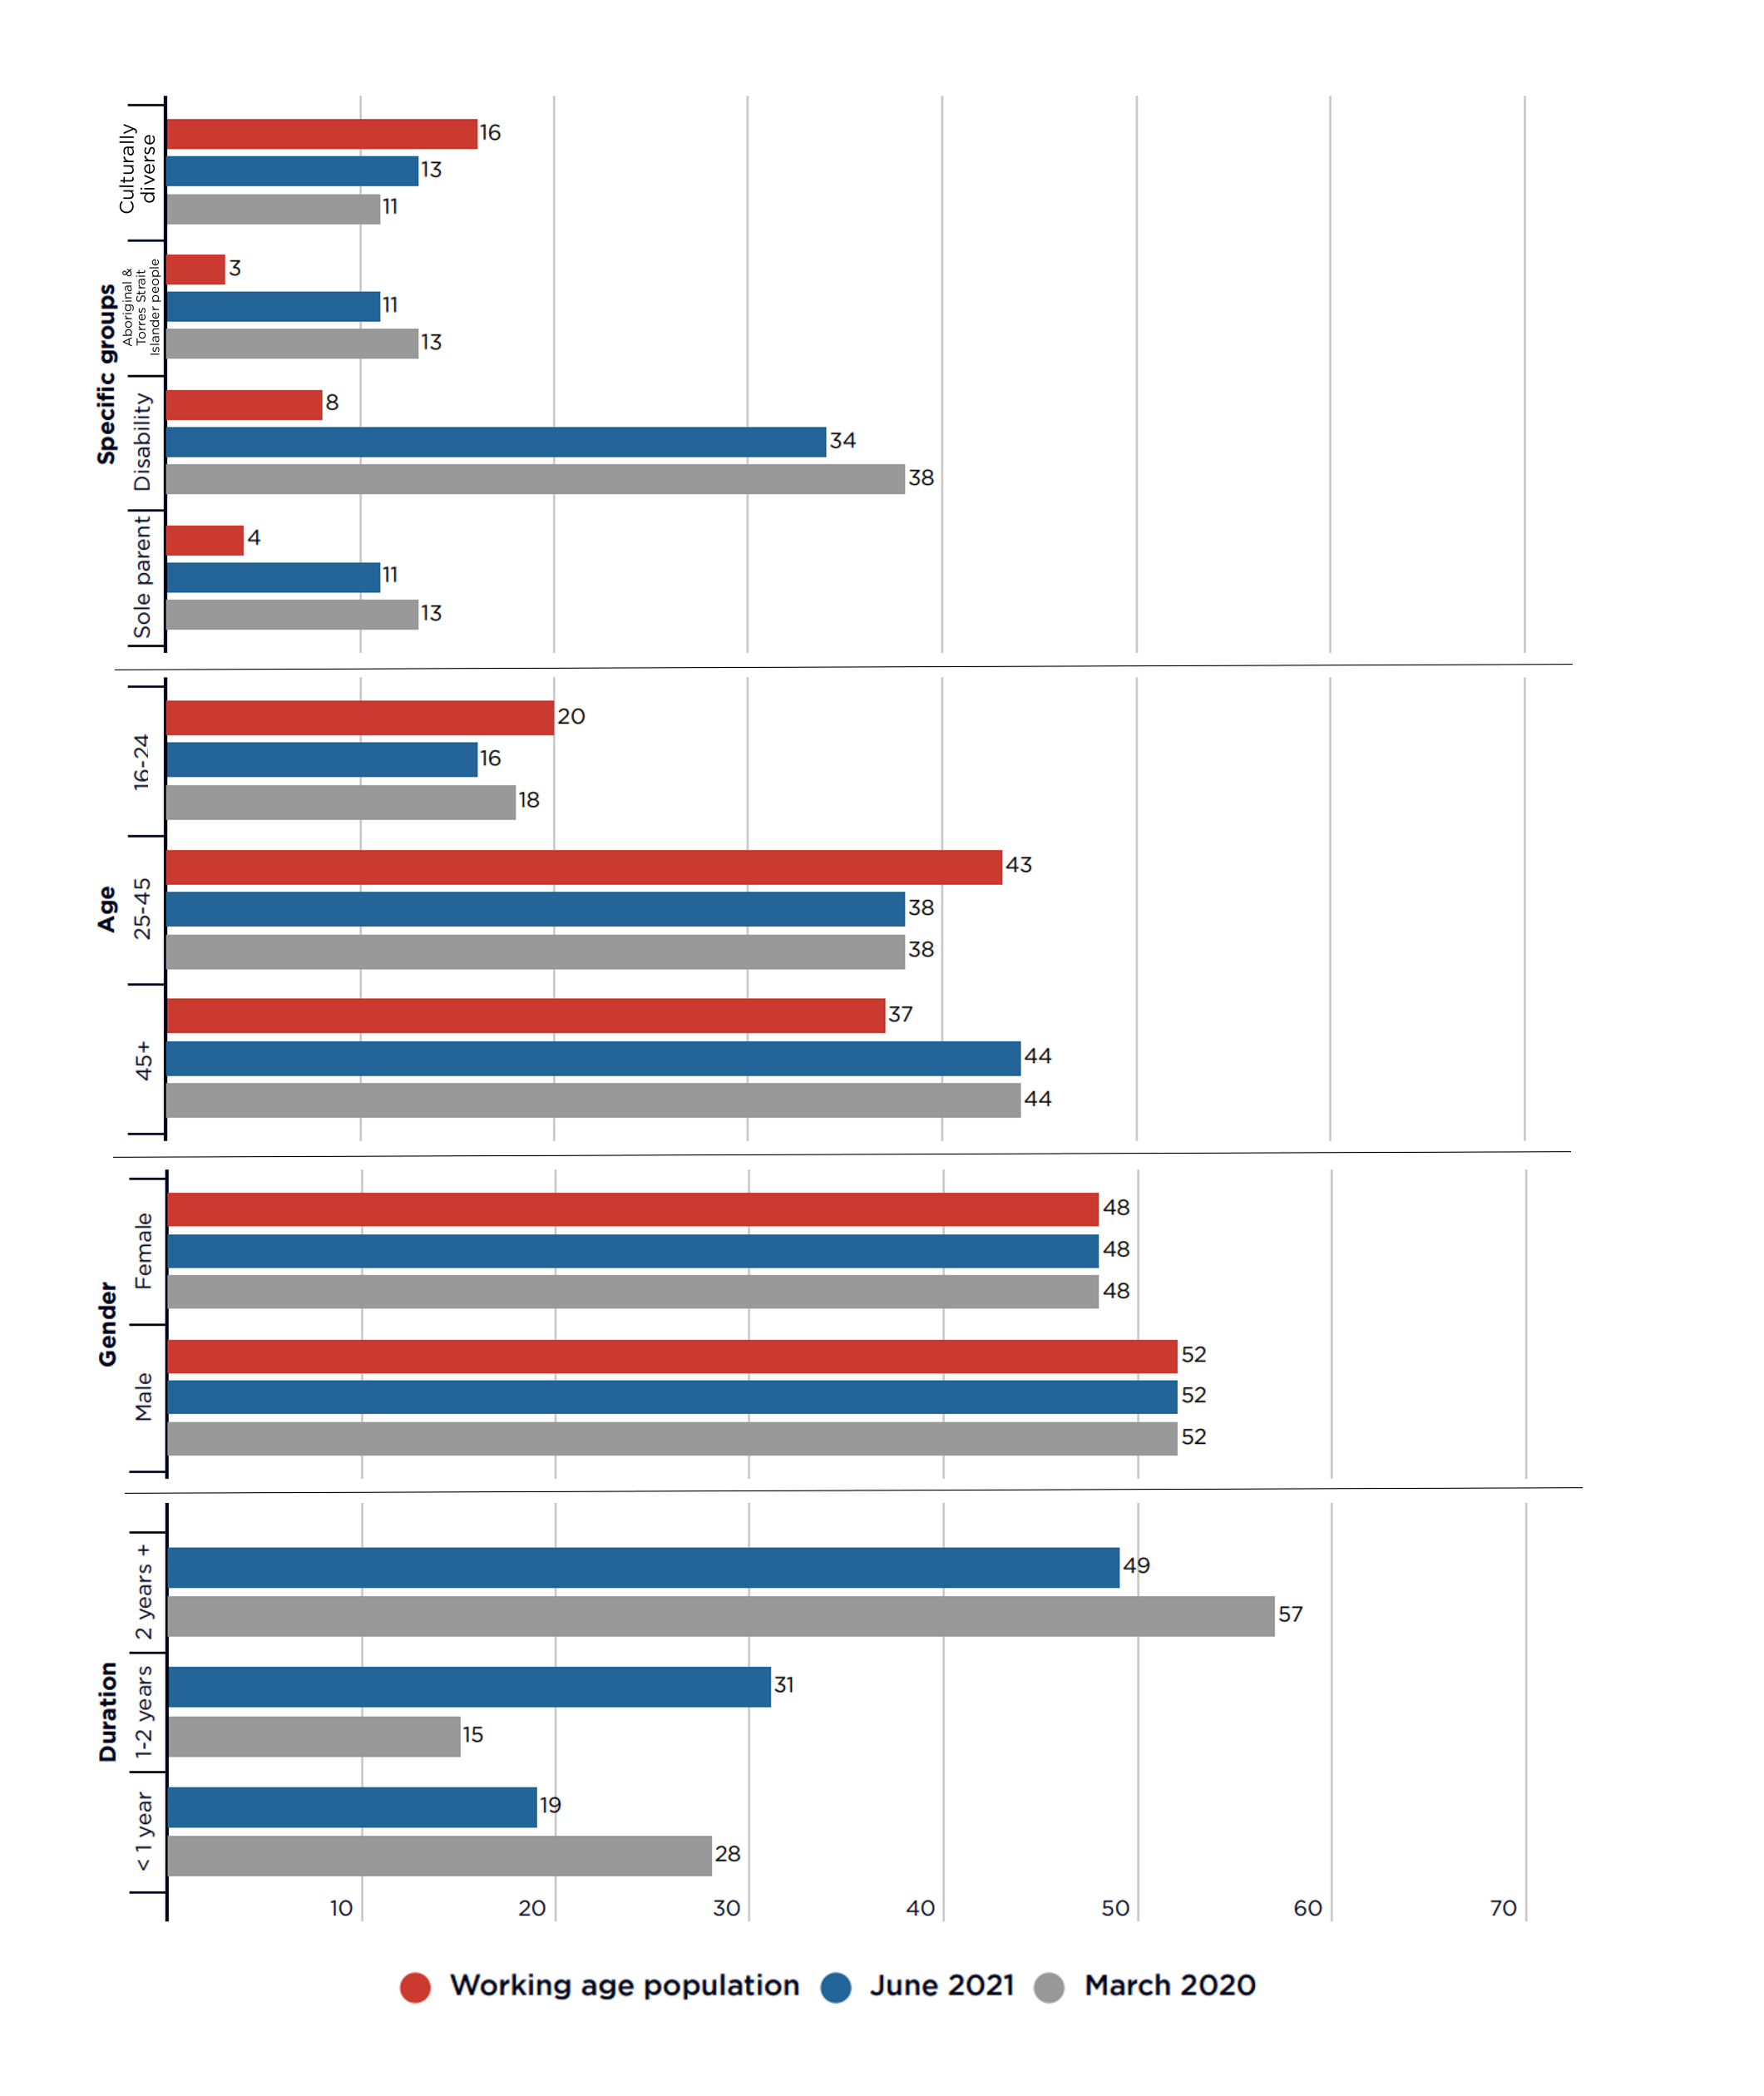
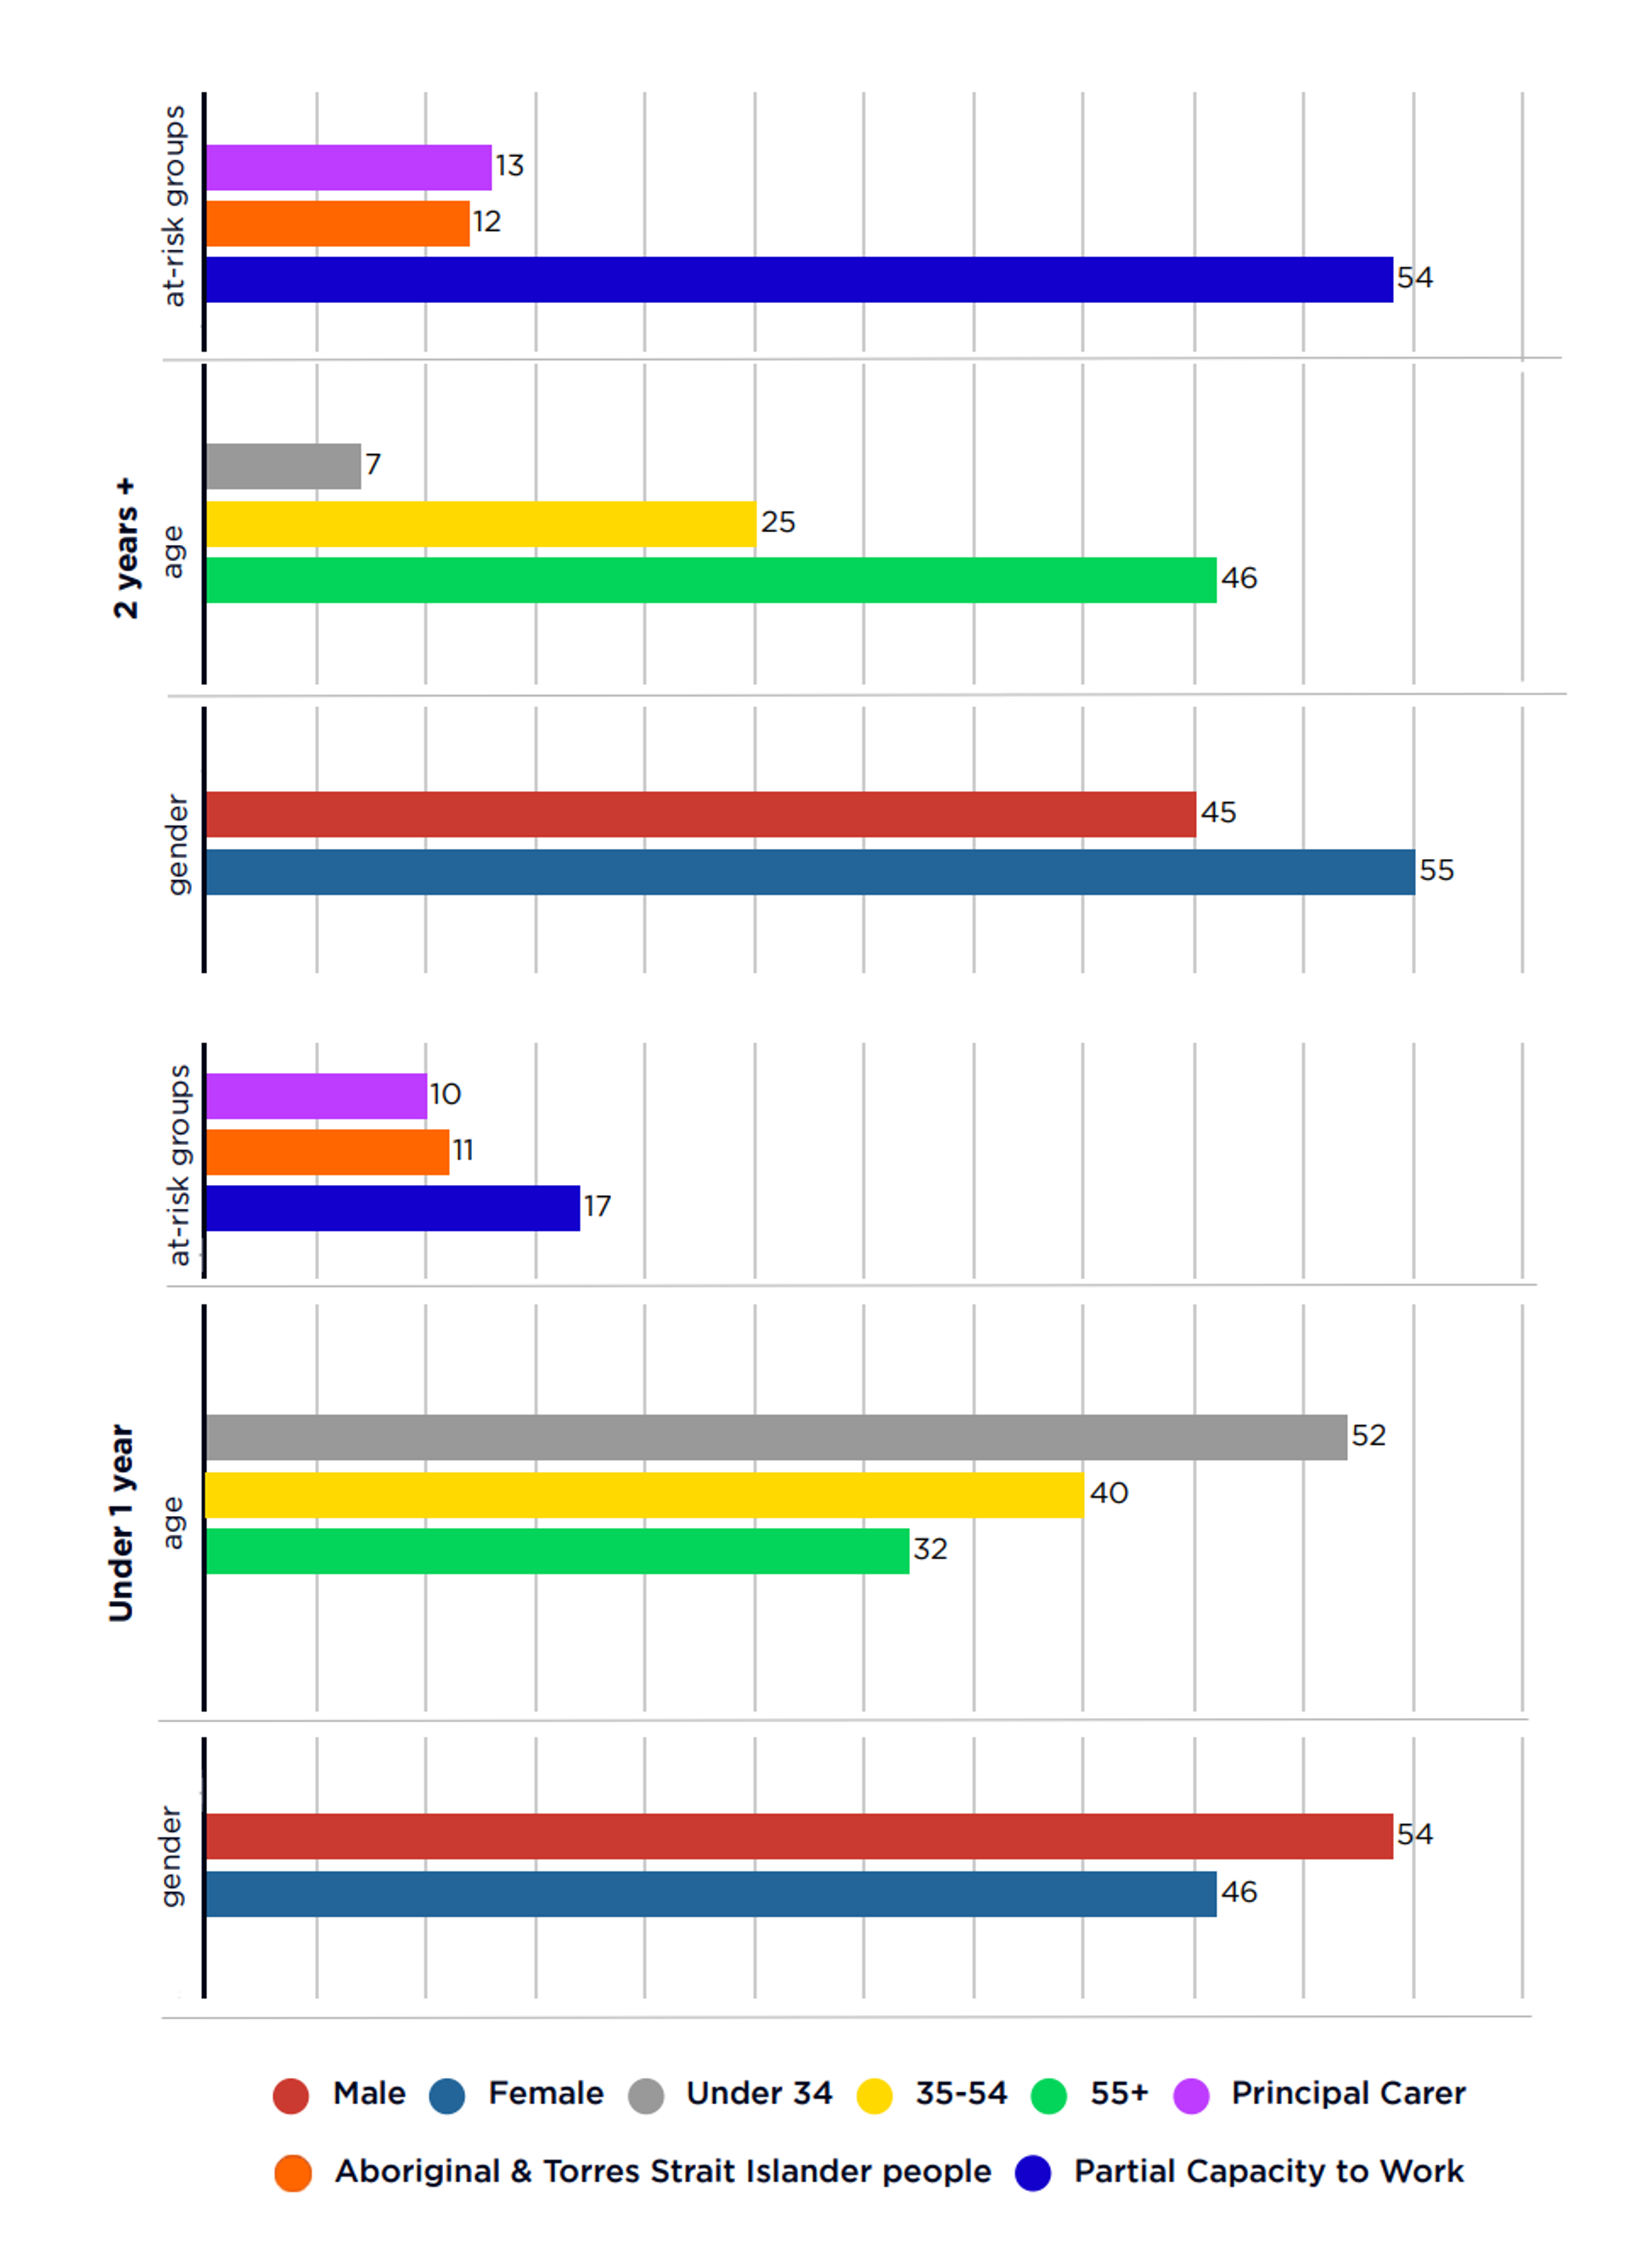
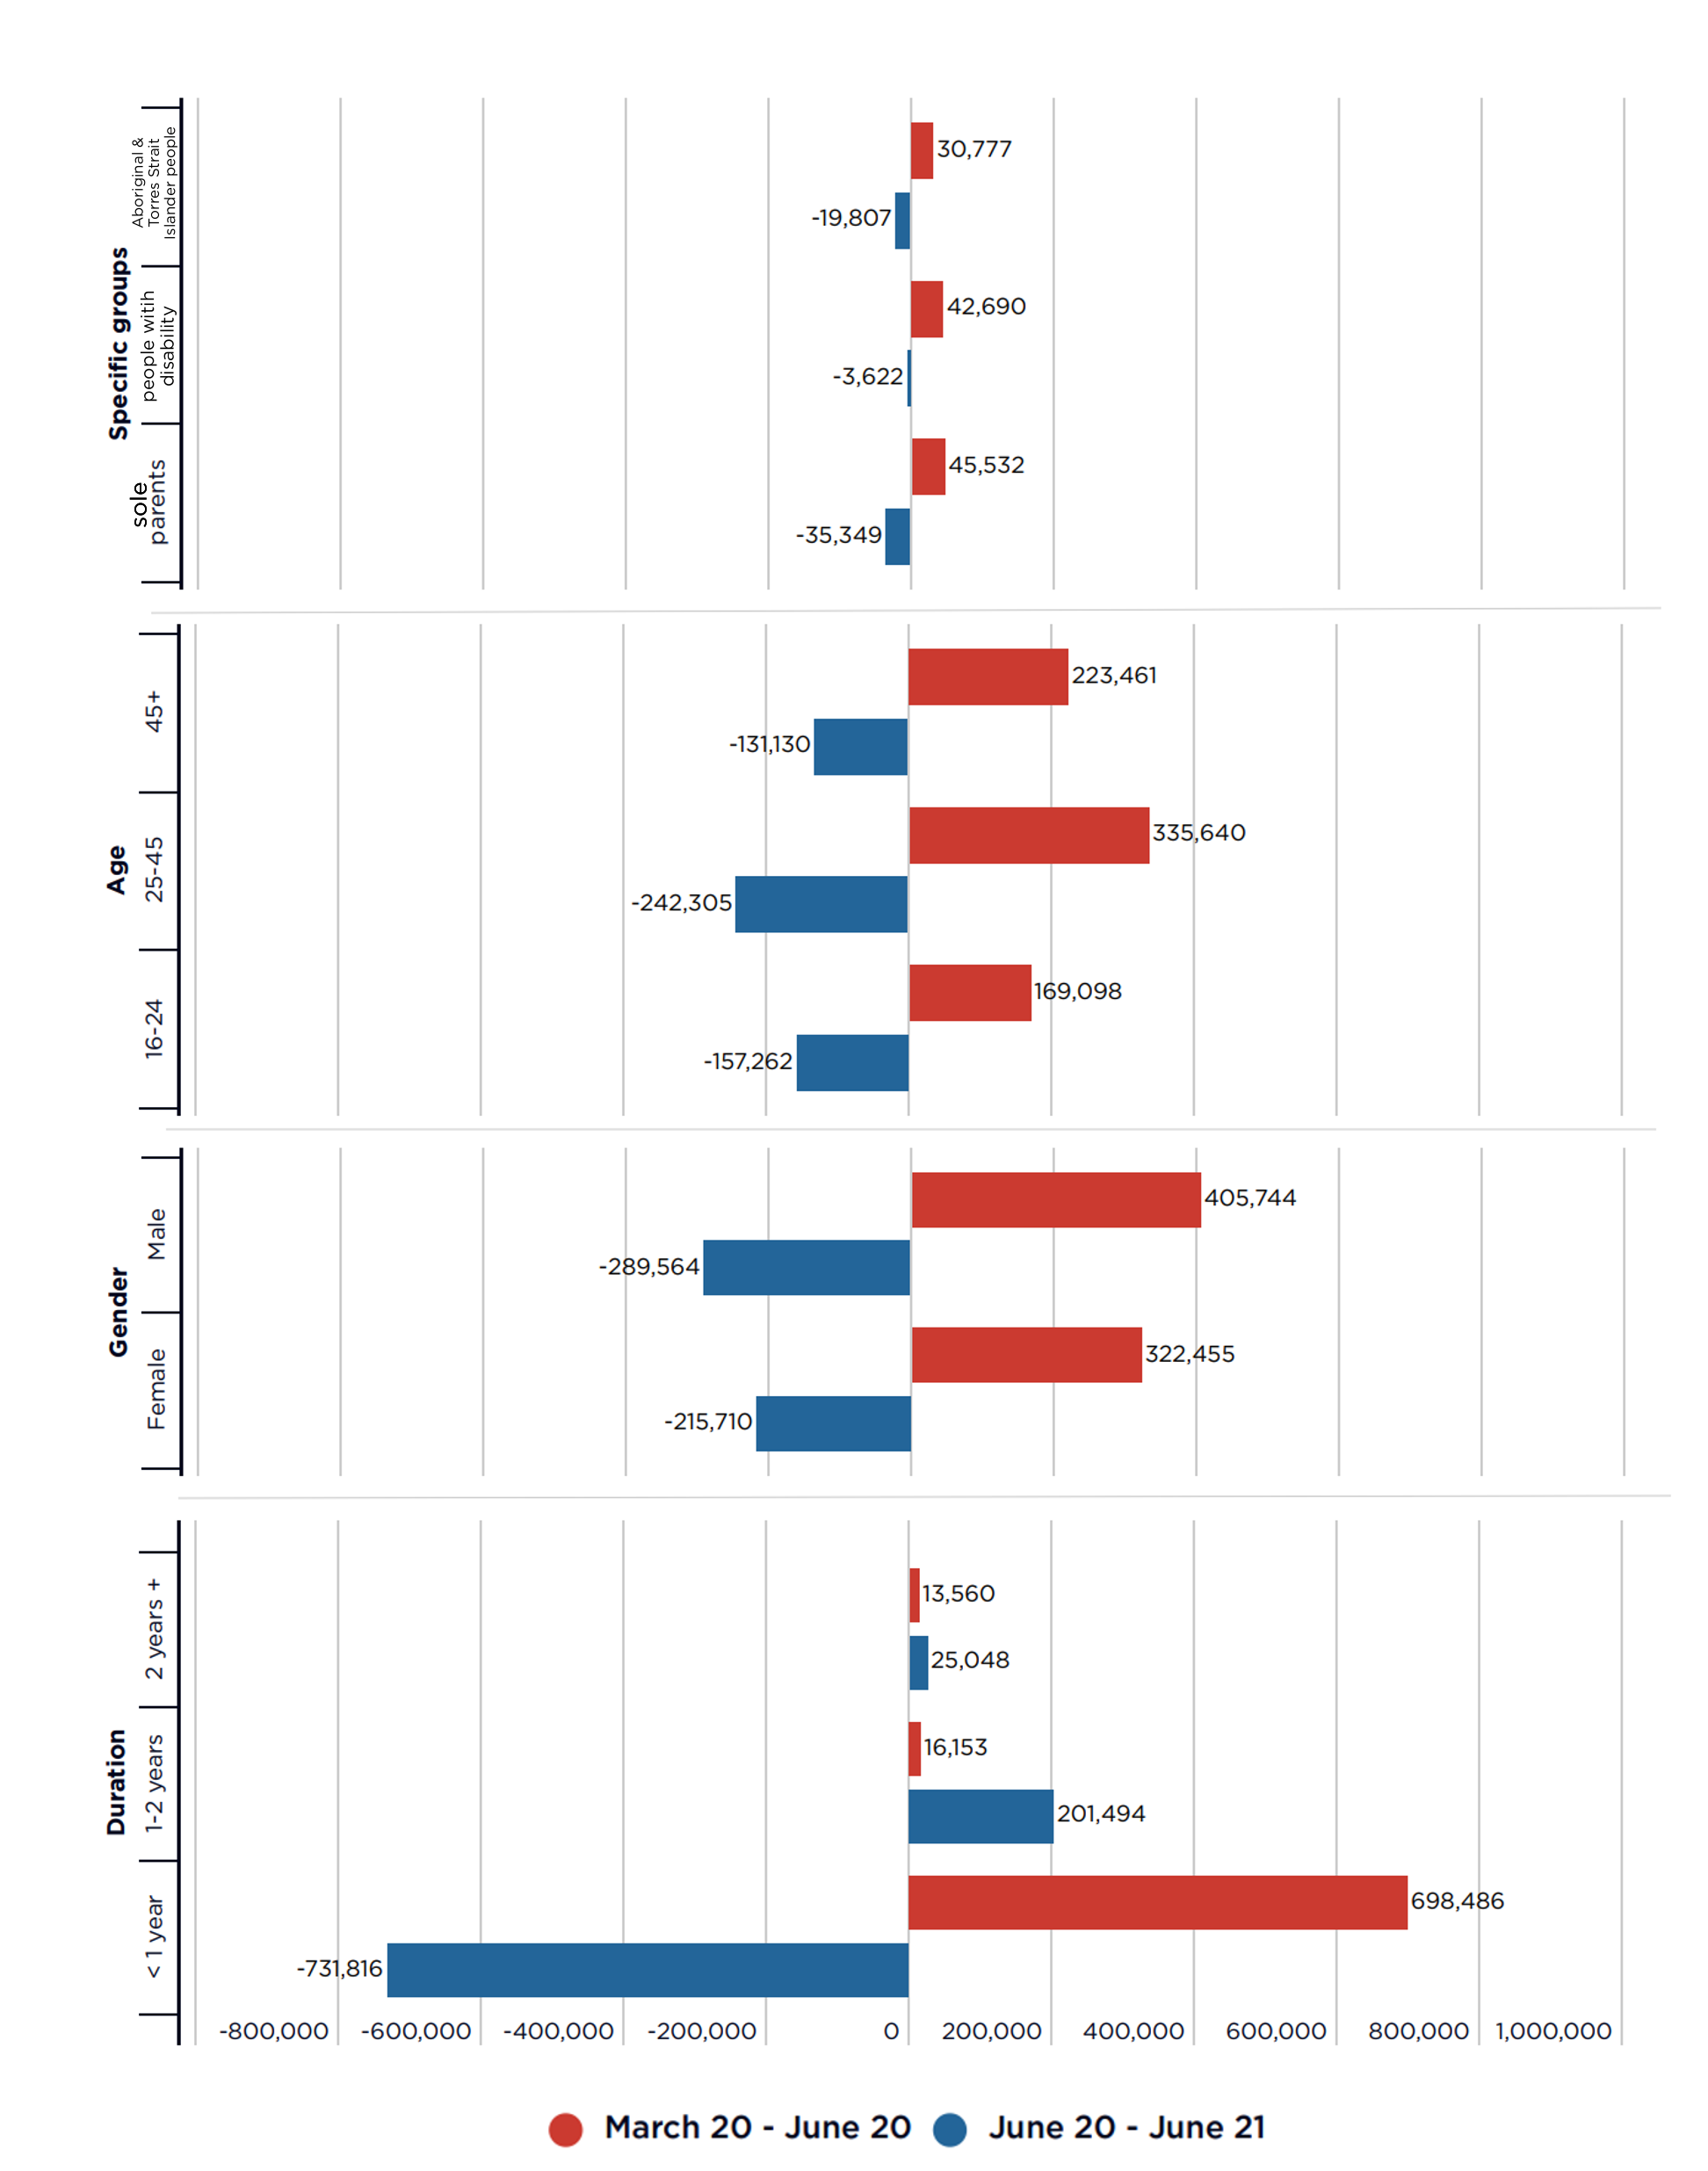
The main unemployment payments are JobSeeker Payment (for those over 21 years of age) and Youth Allowance-Other (for young people who are unemployed, as distinct from fulltime students). JobSeeker Payment replaced Newstart Allowance in March 2020. From March to June 2020, the number of people receiving unemployment payments almost doubled, from 886,000 to 1,614,000. Over a year of quick recovery in employment from June 2020 to June 2021, it fell by 31% to 1,062,000 in September 2021. However, there were still 20% more people on unemployment payments than before the recession. Both before and after the recession, the profile of unemployment payments was older, unemployed long-term, or otherwise disadvantaged in the labour market Figure 1 compares the profile of people on unemployment payments (JobSeeker Payment and Youth Allowance-Other) in March 2020, just before the COVID recession and in June 2021, just before the latest round of lockdowns. The profiles before the recession and one year after it are similar, except for the duration of income support. From March 2020 to June 2021, the percentage of people on unemployment payments: As we explain below, these changes reflect the sudden transition to a deep recession, followed by a quick but incomplete recovery in employment. In both March 2020 and June 2021, the following groups were over-represented among people receiving unemployment payments: The proportion of people on unemployment payments with culturally diverse backgrounds rose from 11% to 14%, though this was lower than their share of the employed population (16%). As discussed later, many of these groups face discrimination in the labour market or other employment barriers.[i] Figure 1 Sources: DSS, Quarterly demographic payment statistics; ABS, 2016 Census Community profiles. Note: Working age population data are for 2016. Culturally diverse = Born in a country whose main language is not English (in this case, working-age data are for employed people only) [i] In 2019, 46% of people using jobactive services were employed three months later compared with 38% for those aged 50 years or more. Similarly, only 29% of people with disability, 31% of Aboriginal and Torres Strait Islander people and 42% of people with culturally diverse backgrounds found employment after participating in the program. (Department of Education Skills and Employment 2020, Employment Services Outcome Report, January to December 2019). People with disability and older people and women are over-represented among those on unemployment payments for two years or more In April 2021, there were 429,000 people (36% of those on unemployment payments) who had been receiving income support for two years or more and 184,000 people (16%) for five years or more (Figure 2). Of the 429,000 people on income support for two years or more: Of the 184,000 people on income support for five years or more: Figure 2: Profile of people on unemployment payments by duration on income support (per cent in April 2021) Source: DSS (2021), Response to Senate Estimates question No SQ21-000493 Note: Percentage of people within each duration category (so age and gender breakdowns for each duration category add up to 100%). On average, people who are unemployed have lower qualifications than those employed A key barrier to paid employment for many people receiving unemployment payments, which we return to later, is their lower average qualification levels. This means they are more likely to be restricted to applying for entry-level jobs than employed people who are changing jobs. Figure 3 shows that 57% of participants in the jobactive program (the vast majority of whom receive unemployment payments) had Year 12 qualifications or less (note that 25% of participants didn’t complete high school), compared with 34% of employed workers. Only 9% of jobactive participants had university qualifications. Figure 3: Highest qualifications of jobactive participants and all employed workers (%) Sources: Department of Jobs and Small Business (2020), Occupational Profiles Summary, Australia (2016 census data); Department of Education Skills and Employment (2020), Response to Senate Additional Estimates Question No. SQ21-000023. Note: 85% of jobactive participants receive unemployment payments. (Department of Education, Skills and Employment (2021), Response to Senate Estimates Question No. SQ21-000857). During the recession, the profile of unemployment payments shifted towards younger people and people recently unemployed Figure 4 shows changes in the number of people receiving unemployment payments in the recession (from March to June 2020) and recovery (from June 2020 to June 2021), broken down by the same characteristics as in Figure 1.[i] This shows that the stability of the profile of unemployment payments shown in Figure 1 is the result of major changes in the recession and recovery that largely offset each another. The recession did not have an equal impact on the groups discussed here, but those who fared worst (overall) in the recession fared best in the recovery. Compared to the profile of recipients before the recession, the new entrants to unemployment payments (on the right side of Figure 3) were more likely to be: [i] There is no single definition of a recession that is generally accepted among economists. Here we refer to the sharp and substantial decline in employment (the largest measured by the ABS in a single quarter) in the June quarter of 2020. (ABS Labour Force Australia June 2020). Employment recovered quickly over the next two quarters to the end of 2020. Figure 4: Change in number of people on unemployment payments (000s from Mar20-Jun20 and Jun20-Jun21) Source: DSS quarterly demographic payment statistics. Note: Blue bars on the right show the increase in unemployment among different groups in the recession from March to June 2020. The increase in shorter-term reliance on income support was due to the entry of large numbers of people to unemployment payments in the recession. Recessions usually have a disproportionate impact on young people as many are entering the labour market at a time when few vacancies are available, and employers are trying to keep their existing workforce. The JobKeeper Payment, which was designed to maintain attachment between employers and their existing workforce, reinforced this. The disproportionate impact of the recession on young people and people with culturally diverse backgrounds was also due to the concentration of job losses in industries such as hospitality and retail. As discussed later, many entry-level jobs in the most affected industries are casual jobs. Workers in casual jobs are more vulnerable to job losses, and they were not eligible for JobKeeper Payment if employed in the position for less than 12 months. Women were more likely than men to be employed in the worst affected industries and to lose their jobs, but fewer women than men moved onto unemployment payments. The most likely reason is that many women withdrew from the paid workforce as they provided most of care for children who could no longer attend childcare or school.[i] [i] In May 2020, 50% of women who lost their jobs were caring for children at home (Biddle n et al 2020, Changes in paid and unpaid activities during the COVID-19 pandemic. ANU Centre for Social Research and Methods. Unlike the above changes in the labour market, it is harder to disentangle the impacts of these changes on reliance on unemployment payments among different groups. In the recovery, recession-induced changes in the profile of unemployment payments were largely reversed Figure 3 (above) also shows that reductions in reliance on unemployment payments in the recovery from June 2020 to June 2021, shown on the left side of the graph) mainly occurred among the groups whose numbers increased most in the recession: In the course of the recession and recovery, the duration of reliance on income support altered dramatically. After rising sharply in the recession by 698,000 people, the number of people receiving unemployment payments for less than a year fell even more, by 792,000. The main reason for this was that more people left unemployment payments during the recovery than entered them. Further, people who are newly unemployed are more likely to find employment than those unemployed long-term. On the other hand, the number of people unemployed for one to two years rose by 201,000, indicating that that around one third of the increase in short-term unemployment in the recession flowed through to long-term unemployment. The number unemployed for over two years did not change much (rising by 14,000 in the recession and falling by 25,000 in the recovery), but this is likely to increase in 2022, two years after the recession. The longer people are unemployed, the more their employment prospects diminish. Among people receiving unemployment payments in 2015, the average probability of not needing those payments 12 months later (in 2016) was just over 50% for those unemployed for less than 3 months, compared with 30% for those unemployed for 12 to 24 months, and just over 10% for those unemployed for more than 5 years.[i] (Figure 5). [i] People can continue to receive unemployment payments while in low paid part time jobs, and for up to three months (at a zero rate) while in a fulltime job. The main reason they left benefits was that they obtained fulltime employment. Figure 5: The chances of leaving unemployment payments diminish over time Source: McGurk E (2016), Analysis of long-term unemployed income support recipients, Long-Term Unemployed Conference, Brisbane December 2016. Australia failed to make serious inroads into long-term unemployment in the long boom after 1990 Figure 6 shows trends on short and longer-term reliance on unemployment payments since the recession in the early 1990s. • After the ‘Job Compact’ (which guaranteed employment for people unemployed for more than 18 months) was abandoned and the Job Network was introduced in 1997. The combination of a decline in shorter-term reliance on unemployment payments and an increase in very long-term reliance at this time suggests that the Job Network was ineffective in assisting people unemployed long-term into employment. • After ‘Welfare to Work’ policies introduced in 2007 (and accelerated in 2013) diverted many sole parents and people with disability from pension payments to unemployment payments. Despite the promise of the Howard and Gillard governments that those affected would be financially better off as they moved off income support into employment, most remained on unemployment payments long-term, at much lower payment rates. Figure 6: Trends in shorter and longer-term reliance on unemployment payments Sources: DSS, Statistical summary of social security payments; DSS, Quarterly demographic payment statistics. Note: This shows duration on income support for people currently receiving unemployment payments. For example, where people transferred directly from Parenting Payment to Newstart Allowance or JobSeeker Payment, ‘duration’ includes periods of reliance on both payments. Another cause of increasing long-term reliance on unemployment payments is changes in the labour market that made jobs that were previously available to people who were unemployed harder to get and harder to keep. We turn to this issue next.Who receives unemployment payments and how did their profile change in the recession?
1.1 Who receives unemployment payments?
Yellow bars (mainly on the left) show the reduction in unemployment in the recovery from June 2020 to June 2021 (just before the latest round of lockdowns). The number of people unemployed for 1-2 years and 2 years or more increased over this period and this is shown on the right side of the graph.
New income support arrangements introduced in response to the recession also affected transitions to unemployment payments among different groups at this time:
1.2 The impact of long-term unemployment on future employment prospects
1.3 The impact of long-term unemployment on future employment prospects
This shows that short-term unemployment rises sharply in recessions and declines reasonably quickly in recoveries. As it was induced by government decisions to effectively close down many industries, the COVID recession is notable for a relatively quick reduction in unemployment once restrictions were lifted.
On the other hand, after the COVID recession long-term unemployment (12 months or more) is more than twice as high (897,000 on income support for more than a year in June 2021) than its peak level following the last recession in 1991 (350,000 or 4% of the labour force). That increase in long-term unemployment prompted a major national inquiry and additional investment of over $1 billion a year in employment assistance.
Moreover, very long-term unemployment (measured here as reliance on income support for two years or more) continued to rise through almost 30 years of employment growth from 1991 to 2020.
All things equal, the profile of people on unemployment payments is likely to become more disadvantaged as unemployment falls, as those who are less disadvantaged in the labour market find jobs more quickly in economic recoveries, leaving behind the more disadvantaged groups.
This does not explain why the absolute number of people relying on unemployment payments continued to rise. The increases occurred in two phases:
In both phases, the increases in very long-term unemployment were brought about by policy decisions.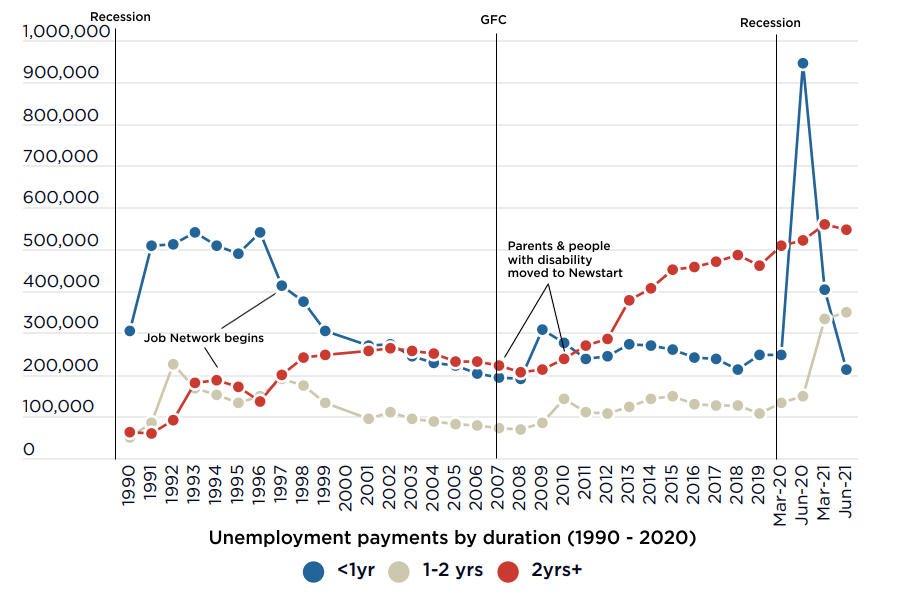
That’s a 31% increase
during the COVID-19 pandemic.
80% of those people have been on income support
for more than a year and 49% for more than two years.
Part 2
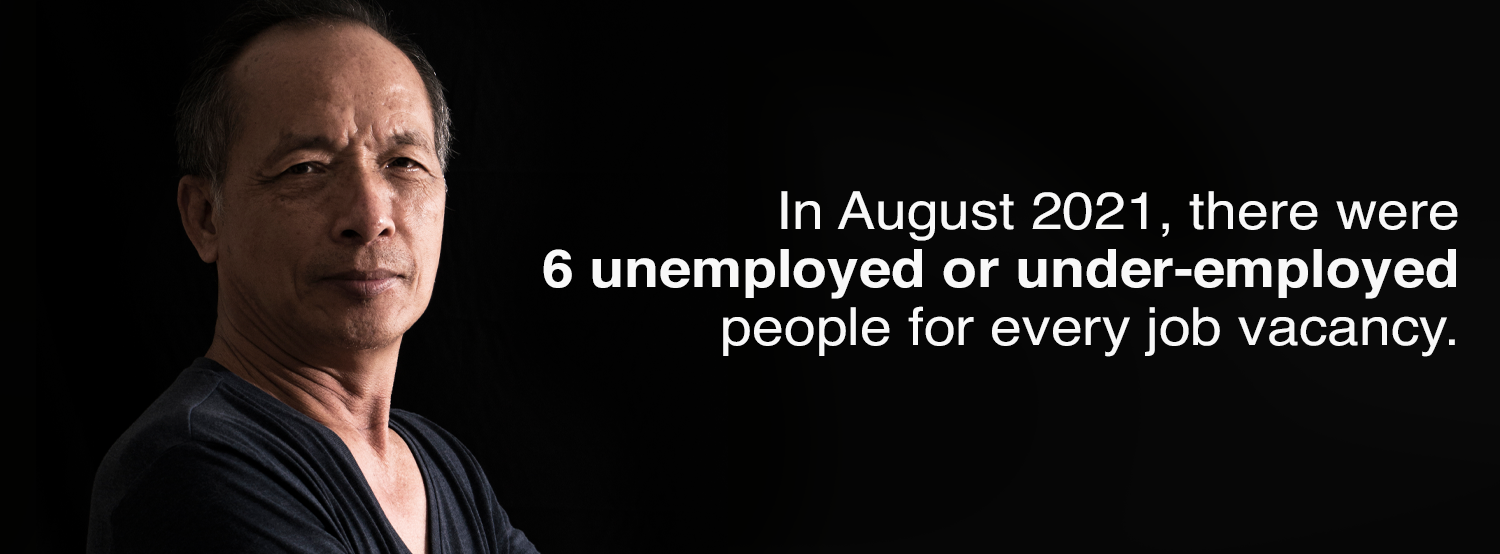
We begin to answer this question by outlining the extraordinary impact of the deepest recession in almost a century on employment, the rapid restoration of jobs as restrictions were eased, and the mismatch between jobs available and people seeking employment. We then turn to longer-term trends in the labour market that impact on employment opportunities for people who are unemployed, especially those with limited formal qualifications. 2.1 Jobs lost and gained in the pandemic The overall number of jobs fell by 7% in the recession, was restored by May 2021, but fell again when lockdowns were imposed in the two largest states Restrictions imposed nationally in March 2020 to prevent the spread of COVID-19, including international border closures and ‘lockdowns’, triggered the deepest recession in almost a century. Employment and paid working hours recovered to above pre-recession levels by May 2021, but fell back again when lockdowns were reintroduced in the two largest states in July (Figure 7): • The reduction in employment from March to April 2020 (by 872,000 or 7%) was the largest recorded by the ABS, while the reduction in paid working hours was even greater (10%) since many employers kept workers employed on reduced hours; Figure 7: Change in total employment and paid working hours throughout the pandemic Source: ABS, Labour Force, Australia. During and after lockdowns, ‘effective unemployment’ is much higher than the conventional measure The conventional unemployment measure rose much less than expected in last year’s recession. To explain the unusual impact of COVID restrictions and public income support such as JobKeeper Payment on people’s access to employment, the Treasury developed a measure of ‘effective unemployment’. In addition to unemployment as defined by the ABS, this included the number of people stood down from their jobs for economic reasons (mainly men on JobKeeper Payment) and the number of people who left the paid workforce because few jobs were available or to care for children during school closures (mainly women with younger children). Figure 8 compares trends in the conventional and effective unemployment rates following the national lockdown in March 2020 and the wave of lockdowns across half the country from July 2021, showing that: Figure 8: Unemployment rate and effective unemployment rate (% of labour force) Source: ABS, Labour Force, Australia (detailed); ABS Insight into hours worked, October 2021. Women, young people, and people in part-time and casual jobs were disproportionately impacted The COVID recession disproportionately affected services such as tourism, hospitality and retail where a high proportion of jobs are casual and part-time, and held by women and young people. Figure 9 shows that employment declined faster among all of these groups, but their employment levels recovered more quickly as restrictions were eased. Over the period from March 2020 to May 2021: Figure 9: Changes in employment (% increase from March to May 2020 and May 2020 to May 2021) Source: ABS, Labour Force, Australia and ABS, Status in employment. Unemployment is now higher in the major cities than in regional areas. Since the longest lockdowns occurred in capital cities (especially Sydney and Melbourne), unemployment is now higher in cities than in the country (reversing past trends), while some States avoided long lockdowns by closing their borders (Figure 10). [i] In September 2021: Queensland (4.8%) and South Australia (4.8%) have the highest unemployment rate using the conventional measure, though it is likely that effective unemployment is greater in New South Wales and Victoria due to recent prolonged lockdowns. Figure 10: Unemployment by state/territory, capital cities and regions (September 2021) Source: ABS, Labour Force Australia. [i] Lowe P (2021), The Labour Market and Monetary Policy. Speech to Economic Society of Queensland, 8 July 2021. Reserve Bank of Australia. The recession accelerated a long-term decline in entry-level jobs Figure 11 shows how low-paid, middle paid and higher-paid employment fared in recession and recovery. Overall, from August 2019 (before the pandemic) to August 2021, lower paid positions declined by 148,000, middle-paid jobs declined by 69,000 while higher paid positions (managers and professionals) rose by 405,000. Given the link between qualifications and higher-paid jobs, this implies reduced employment prospects for the majority of people on unemployment payments. Figure 11: Changes in employment by weekly pay level from August 2019 to August 2021 (000s of jobs) Source: ABS Labour Force Australia (detailed), August 2021. Note: Major ANZSCO occupation groups are divided into three categories according to average weekly pay levels (in main job) for each group. This continues a long-term trend away from entry-level employment, from 27% of all employment in 2007 (before the Global Financial Crisis) to 25% in 2021 (Figure 12). [i] Figure 12: Trends in the share of all jobs, and part-time employment, at the lowest two skill levels Source: ABS, Characteristics of employment. Note: Entry-level jobs = ASCO skill levels 4 and 5 including Labourers and Related Workers, Elementary Clerical, Sales and Service Workers, Intermediate Clerical, Sales and Service Workers, and Intermediate Production and Transport Workers. [i] Since turnover for retail jobs is more than 40% greater than average, and for labourers more than 20% greater, growth in overall vacancies for these jobs will be higher than indicated here, but this means that the risk of losing those jobs is also greater since more people are moving in and out of these jobs. Source: Shah, C & Dixon, J 2018, Future job openings for new entrants by industry and occupation, NCVER, Adelaide. Entry level jobs are increasingly part-time and casual In addition to the decline in the number of entry level jobs, the hours worked in these jobs are falling as fulltime positions are divided into smaller parcels of work offered on a part-time basis when needed.[i] This means people remain on unemployment payments longer (on income-tested part-rate payments) and that they return to them more frequently after obtaining employment. Australia has the fourth-highest rate of part-time employment (30% of jobs) and the second highest rate of casual employment in the OECD (25% of jobs).[ii] Figure 12 (above) showed that the proportion of entry level jobs that are part-time rose from 39% in 2007 to 43% in 2021. Many people prefer part-time jobs so that they can combine paid work with care or study. However, one third of part-time workers want more paid hours.[iii] Among part-time workers; men, blue-collar workers, migrants, people in entry-level occupations, casual workers, and people who were previously unemployed are more likely to be under-employed.[iv] Most casual employees are entry-level workers who have been in the same job for over a year.[v] As discussed (see Figure 8), the pandemic recession highlighted the precariousness of casual employment. One of the puzzles of the recovery from this recession is the combination of high effective unemployment rates and employer reports of labour shortages (unfilled vacancies), including for entry level positions, as employment recovered in early 2021. Those concerns were most often raised in industries such as horticulture, hospitality and tourism in regional areas, and hospitality and personal care services in capital cities, which had stood down or retrenched large numbers of workers during lockdowns. As lockdowns are easing in the two largest States, we are hearing those concerns again.[vi] Increases in income support in the pandemic did not stop people from applying for jobs Some argued that the combination of labour shortages in some industries and high unemployment demonstrated that higher income support introduced during the pandemic (Coronavirus Supplement and JobKeeper payment) was too generous, discouraging people from applying for jobs when lockdowns eased. Careful research by labour market economist Professor Jeff Borland disproved this. He found that financial incentives to seek fulltime or part-time employment remained strong and there was no reduction in flows from unemployment to employment after income support was increased.[vii] A major reason for labour shortages is that COVID restrictions increased ‘churn’ in the labour market A more credible explanation for labour shortages is that the sudden imposition and lifting of COVID restrictions (including closures of international and State borders) led to unusually high turbulence or ‘churn’ in the labour market. [viii] Employers who stood down or retrenched workers during lockdowns or whose workers left the paid workforce at this time, suddenly had to reconnect with those workers or find new people when the lockdowns ended. Many had already moved on to other jobs, left the country (in the case of temporary migrant workers) or were still out of the labour force caring for children or relatives with a chronic illness: ‘The rapid increases in labour demand that have occurred as COVID‐19 has been brought under control and restrictions on economic activity relaxed, and the extent of structural change occurring in labour demand and supply due to COVID‐19, make it almost inevitable that there will be some sectors where adjustment takes longer than usual – – regardless of the COVID‐19 Supplement.’ (Borland J 2020, op cit). While the JobKeeper Payment succeeded in keeping many workers connected with their employers, this was much less likely for workers in industries such as hospitality that rely on short-term casual employment and temporary migrants (both groups were excluded from JobKeeper in any event).[ix] One indicator of labour market churn is the ‘vacancy rate’ (the ratio of vacant jobs to overall employment). Figure 13 tracks the vacancy rate separately for all jobs and for entry-level jobs: Two reasons for higher vacancy rates in entry-level jobs have already been discussed: those jobs were disproportionately impacted by the recession and a high proportion of them were casual positions.[x] Figure 13: Job vacancies per thousand jobs Sources: ABS, Labour Force, Australia; National Skills Commission, Internet vacancy data. Note: The number of vacancies per 1,000 jobs is a measure of labour turnover. [i] Cassidy N & Parsons S (2017), The rising share of part-time employment, Reserve Bank Bulletin September 2017. [ii] OECD (2020): Part-time employment rate (indicator). doi: 10.1787/f2ad596c-en (Accessed on 09 March 2020). The Netherlands has the highest rate of part-time employment. Gilfillan G (2018) Characteristics and use of casual employees in Australia, Parliamentary Library; Kler P et al (2017) op cit; OECD Labour market statistics. Spain has the highest share of casual jobs. [iii] In January 2020, 31% of part-time workers were under-employed. Source: ABS (2020), Labour Force, Australia, Detailed, Quarterly, 6291.0.55.00 [iv] Shah, C & Dixon, J (2018), Future job openings for new entrants by industry and occupation, NCVER, Adelaide. [v] Of all casual employees, 81% expected to be in the same job in 12 months’ time, and 36% wanted more paid hours. [vi] Mizen R, Companies brace for fierce battle to attract workers, AFR Oct 21, 2021 [vii] Borland J (2020), Would a rise in JobSeeker affect incentives for paid work? Labour market snapshot #71 November (19) 2020, Department of Economics, University of Melbourne. [viii] Borland J (2021), Employment growth prospects for the next 6 months: Full steam ahead or looming roadblocks? Labour market snapshot #80, July (8) 2021, Department of Economics, University of Melbourne. [ix] Treasury (2021), Insights from the first six months of JobKeeper. [x] Employee turnover in retail sales jobs is more than 40% greater than average, and that for labouring jobs is more than 20% greater (Shah, C & Dixon, J 2018, op cit). The higher level of ‘çhurn’ in casual entry-level jobs increases the number vacancies without increasing the number of jobs. So far, labour shortages haven’t forced employers to lift wages Despite these concerns about labour shortages, the Reserve Bank has indicated it won’t begin to lift its target interest rate until its favoured measure of labour market ‘tightness’ – wages growth – recovers to a level well above the historically-low increases (2-3% a year) recorded before the pandemic: ‘Many firms are relying on non-wage strategies to retain and attract staff. Some are also adopting a ‘wait and ration’ approach: wait until labour market conditions ease, perhaps when the borders reopen, and until then, ration output. By waiting and rationing, firms can avoid entrenching a higher cost structure in response to a problem that might be only temporary.’ (Lowe, 2021).[i] Figure 14 shows that as employment recovered in the first half of 2021 employers were not offering much higher wages in response to labour shortages.[ii] Figure 14: Quarterly increase in wage price index (%) Source: Australian Bureau of Statistics, Wage Price Index, Australia June 2021 Note: Excluding impacts of changes in workforce composition due to the recession and recovery. [i] Lowe P (2021), op cit.. [ii] The highest annual pay increases in 2020-21 were in industries with relatively highly-paid skilled workers such as professional and scientific and technical services (2.5%) and construction (2.2%). Annual pay rises were much less in industries with more entry-level jobs such as retail (1.6%), and accommodation and food services (1.7%). and health care and social assistance (1.8%). One reason for labour shortages in some industries is over-reliance on temporary migrant workers Temporary migration has grown very strongly in recent years, especially among international students and working holidaymakers (back-packers) who typically work in entry-level jobs in industries such as hospitality, retail, personal services and agriculture. Over the decade of the 2000s, employment of temporary visa-holders comprised half the overall growth in the youth labour force.[i] This is a profound shift from our traditional emphasis on permanent, skilled migration. Figure 15 shows that just before the recession there were around half a million workers on temporary visas (other than the special visas for New Zealand residents which allow people to live in Australia long-term). This dropped to between 100,000 and 200,000 by March 2021 as our international border was closed and temporary migrants already in Australia were denied income support and encouraged to ‘go home’, a policy that was widely opposed.[ii] Figure 15: Temporary migrant workers Sources: ABS, Labour Account Australia March 2021 and ABS Labour Force Australia – seasonally adjusted. Note: Workers on temporary visas, excluding New Zealand residents, based on the difference between ABS Labour Account data (which includes them) and Labour Force data (which does not), minus Australian Defence Force employees. [i] Productivity Commission (2016), Migrant Intake into Australia. The Commission notes (at p201) that temporary visa grants among international students, working holiday-makers and temporary graduate visa categories, measured as a proportion of Australia’s youth labour force increased from 14 per cent in 2004-05 to 27 per cent in 2013-14, and that these temporary migrants comprised over 13 per cent of total employment of those aged 15 to 24 years in September 2015. [ii] ACOSS (2020), Who misses out on access to Australia’s safety net under Covid19? Figure 16 gives an indication of industries that rely heavily on temporary migrant workers including agriculture (29%), rental hiring and real estate (25%), accommodation and food services (14%), retail (10%) and health care and social assistance (5%). Employers in these industries often report labour shortages in entry-level positions, though a fall in their temporary migrant workforce is unlikely to be the only reason.[i] Figure 16: Share of temporary migrants in employment, by industry (% in March 2020) Sources: ABS, Labour Account Australia March 2021 and ABS Labour Force Australia – seasonally adjusted. Note: These estimates should be interpreted with caution as a comparison of these two data sources is less robust at the industry level. [i] Borland J (2021), op cit. Migration has made a vital and positive contribution to the living standards and the diversity of the Australian community, and migration levels generally have little impact (positive or negative) on employment and wages among the resident population.[i] However, when the Productivity Commission examined this issue in 2016 it was unable to draw firm conclusions on the specific impact of temporary migration on employment or rates of pay in entry-level jobs. The Reserve Bank recently raised concerns that high levels of temporary migration to fill entry-level positions could suppress wages for those jobs.[ii] In the wake of the 7:11 and Caltex scandals and widespread reports of under-payment of horticultural workers, concerns have been raised about the vulnerability of temporary visa holders to exploitation.[iii] These regulatory issues should be resolved before large-scale employment of workers with temporary visas in entry-level jobs resumes. Successful programs such as the Seasonal Worker Program provide a model for effective support of temporary migrant workers and their employers, and this model should be adopted for the recently-announced Australian Agriculture Visa. To understand why the number of people on unemployment payments is still 25% higher than before the pandemic, we need to view the labour market from their standpoint. There are still six people unemployed-or under-employed chasing each job vacancy. One way to measure how easy or hard it is for people to find a job is to compare the number of people seeking employment with the number of vacancies advertised. This rose sharply from 8 people before the recession to a peak of 21 during the recession, then gradually declined during the recovery to 6 in August 2021 (Figure 17). This is not the whole story. There are many others competing for jobs, including people aiming to change jobs and new entrants to the workforce such as education leavers and new migrants. Based on an employer survey, the Department of Employment, Skills, Small and Family Business estimated that in 2018 there were an average of 19 applicants for every job.[iv] Figure 17: Number of unemployed + underemployed people per job vacancy (2007-19) Sources: ABS, Job Vacancies and Labour Force, Australia; National Skills Commission Internet Vacancy Index (IVI). [i] Productivity Commission (2016), op cit; Breunig R et al (2016), The relationship between immigration to Australia and the labour market outcomes of Australian workers. Technical Supplement A to Productivity Commission (2016) ibid. Note that Breunig et al did not specifically examine the impact of temporary migration on the labour market, due to data limitations. [ii] Lowe P (2021), The Labour Market and Monetary Policy. Speech to Economic Society of Queensland, 8 July 2021. Reserve Bank of Australia. [iii] See for example, Senate Select Committee on Temporary Migration (2021), Report. National Agricultural Labour Advisory Committee (2020), National Agricultural Workforce Strategy. The Fair Work Ombudsman states in its latest annual report that: ‘Migrant workers continue to be over-represented in the FWO’s work, due to their limited knowledge about Australia’s workplace rights and entitlements, and language and cultural barriers. While they make up only 4% of the Australian workforce, they accounted for: [iv] Department of Employment, Skills, Small and Family Business (2018): Survey of Employers’ Recruitment Experiences: 2018 Data Report There are 12 jobactive program participants for every entry-level job vacancy. Recalling that most jobactive participants have only Year 12 qualifications or less, Figure 17 (above) also compares the number applying for each entry-level job. This is double the above estimate for all unemployed and under-employed people: 12 jobactive participants for every entry-level job in August 2021.[i] It’s unrealistic to expect unemployed people to fill job vacancies the moment COVID restrictions are eased. The government announced that COVID Disaster Payments will be removed and ‘mutual obligations (including requirements to apply for 20 jobs a month) will be restored as soon as 80% of people over 16 in a State are double-vaccinated. This implies that jobs will be quickly restored when lockdowns end, and people who are unemployed will be able to fill them immediately.[ii] It’s no surprise that the efficient matching of unemployed workers to jobs failed to ‘snap back’ the instant COVID restrictions are eased. Firstly, many people out of paid work were wary of catching COVID when lockdowns were eased last year (before they were vaccinated) and many still are now (since they know COVID is likely to spread widely once lockdowns are eased): Secondly, many people who are unemployed don’t live in places where labour shortages are most acute, such as horticultural and tourist regions. It is not realistic to expect large numbers of people on very low incomes to jeopardise their tenancies in the city to move to regional areas with high rents for temporary jobs that often pay below minimum wages, as is all too often the case with horticultural jobs: Thirdly, as discussed there is a mismatch between the skills and capacities of people who are unemployed and those required in the jobs available. For example: Fourth, many employers are still reluctant to recruit people receiving unemployment payments. ‘’At age 24, the Mackay job seeker is desperately applying for jobs without success, as one of about 6000 people in the Mackay region living below the poverty line, contrary to the situation Mackay Region Chamber of Commerce president Geoff O’Connor describes as an ‘employee’s market’… ‘I can guarantee that I’ve probably applied for every job that involves hospitality in this entire town,’ the former kitchen-hand and dishie said. ..’I’ve done a trial, never had a call back, I’ve been refused an interview, I’ve gone to a lot of places.’ (Petith H, Why Vinnies says JobSeeker increase will keep families from homelessness, Cairns Post 21/10/21). [i] Anglicare Australia publishes a regular Jobs availability snapshot. This is a different measure, in that they compare the number of highly-disadvantaged jobactive participants (Stream C) with the number of ANZSCO Level 5 positions, which was 8 people per job in July 2021. [ii] ACOSS (2021a), A new post-lockdown health hazard: Sudden reintroduction of unrealistic job search requirements and penalties. [iii] ACOSS (2021b), ACOSS backs call for vaccination gap for people with disability to be closed before easing COVID restrictions, as well as for other high risk groups. Media Release 27/9/21. [iv] Corelogic (2021) Quarterly rent review, September 2021; Reserve Bank of Australia (2021), Submission to the Inquiry into Housing Affordability and Supply in Australia. In this research, an area was deemed affordable if the annual median rent was less than 30% of household disposable income. [v] Regional Australia Institute estimates derived from National Skills Commission data.What jobs are available to unemployed people?
• In the recovery from May 2020 to May 2020, employment grew by 1,000,000 or 8% and paid working hours rose by 12%.
Note: Changes in total employment and monthly working hours since September 2019.
Note: Effective unemployment = unemployed + increase in people stood down for economic or ‘other’ reasons + reduction in labour force compared to pre-lockdown levels (February 2020 and May 2021).
Note: The first period includes the recession, and the second period is the recovery prior to the latest round of lockdowns. The decline in casual employment is measured from February to May 2020.
(2007-19)2.2 Why are there labour shortages when effective unemployment is still high?
2.3 What the labour market looks like from the standpoint of people on unemployment payments
Note: Bottom line – number of people who are unemployed or underemployed for each job vacancy (ABS)
Top line – number of jobactive participants per position at ANZSCO skill levels 4 & 5.
But this does not include people
who were looking to change jobs.
Entry-level jobs dropped by 148,000, while higher-paid positions rose by 405,000,
reducing employment prospects for many people on unemployment payments.
Part 3
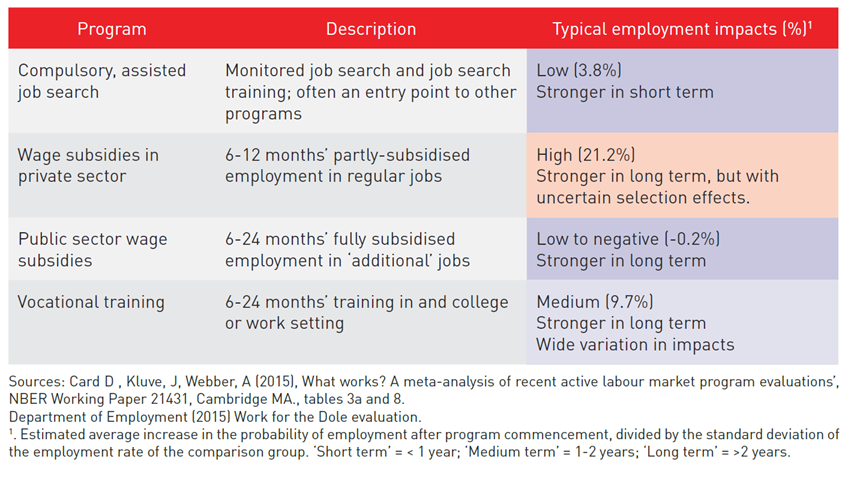
Compared with other wealthy nations, Australia is parsimonious in its support for people who are unemployed. Unemployment and Parenting payments are too low to live decently and search for jobs People who are unemployed and live in a low-income household receive two main unemployment benefits: JobSeeker Payment ($391pw including Rent Assistance for a single adult) and Youth Allowance, unemployed ($331pw).[i] These unemployment payments are the lowest in the OECD for individuals who recently became unemployed (Figure 18). [i] Note that Youth Allowance is also received by full-time students (not included in the data in this report). Figure 18: Unemployment benefits as a % of 2/3 fulltime wage, after tax & housing benefits (2019) Source: OECD, Benefits and wages data base, www.oecd.org/els/benefits-and-wages-statistics.htm Note: For a single person without children, 1 month unemployed, previously on two-thirds of the average fulltime wage, includes Rent Assistance. Recent research by the ACOSS-UNSW (Sydney) research partnership found that, despite a $25pw increase in JobSeeker Payment in April 2021, the value of unemployment payments has fallen substantially compared with community living standards over the last two decades. From 2000 to 2021:[i] Australia spends less than half the wealthy-nation average on employment assistance The government spends $1.3 billion annually on jobactive services, an average of around $1,600 per participant (or $2,200 for each person unemployed for 2 years or more).[ii]. In 2017, overall spending on employment services and programs for unemployed people in Australia (at 0.23% of GDP) was less than half the OECD average level (0.48%), (Figure 19).[iii] Figure 19: Public expenditure on employment programs (% of GDP in 2018) Source: OECD (2021), Employment Outlook. [i] Bradbury B & Hill P (2021), Australian income support since 2000: Those left behind. ACOSS/UNSW Sydney Poverty and Inequality Partnership, Build Back Fairer Series, Report No. 2, Sydney. [ii] Senate Standing Committee on Education and Employment (2020), Response to Senate Estimates question No. EMSQ19-001229. [iii] OECD (2020), Public expenditure data base at https://stats.oecd.org/Index.aspx?DataSetCode=LMPEXP# Activity requirements (called ‘mutual obligations’) for people on unemployment payments are among the strictest in the OECD.[i] They must typically agree to a Job Plan, attend regular appointments with their jobactive service, apply for up to 20 jobs each month, and for three to six months of each year of unemployment participate in Work for the Dole (working for their benefits for 15 to 25 hours a week) or other compulsory ‘Annual Activities’ such as part-time employment, part-time study or vocational training, or employability training.[ii] If they do not fully comply, their benefits are suspended on two days’ notice until they meet the requirement. If they repeatedly miss employment service appointments or don’t report the required number of monthly job applications, they may lose up to four weeks’ payments. Between December 2020 and April 2021, an average of 167,000 payment suspensions were imposed each month across the jobactive and Parents Next programs.[iii] Jobactive is the government’s main employment service. It comprises a network of 42 for profit and not for profit service providers across Australia.[iv] They are funded by the Department of Education Skills and Employment to provide employment counselling, job referrals, and training and work experience opportunities for unemployed people. Service providers are paid according to the number of people they assist, how disadvantaged they are in the labour market, and whether they obtain jobs lasting at least 3 months. They also have access to a modest Employment Fund to invest in help to overcome barriers to employment (such as short training courses and help with travel costs).[v] In the September quarter 2021, there were an average of 923,000 people in jobactive services (a much larger number were assisted through the year), most of whom received JobSeeker or Youth Allowance.[vi] Most people receive very limited assistance to prepare for or find employment The main service provided in most cases is short interviews every few months with employment consultants, which are as much about compliance with activity requirements as help to find employment. While practical help is provided with resumes or short training courses, it is mainly left to each participant in the program to find their own employment.[vii] With caseloads averaging at least 140 people, it is not possible for employment consultants to offer much more help than this for most people.[viii] The government’s Employment Services Expert Advisory Panel recommended far-reaching changes An Expert Advisory Panel appointed by the government to review employment services reported in 2019 that services were insufficient for people unemployed long-term, and too compliance focussed.[ix] It recommended that: The government subsequently trialled a New Employment Services Model in two employment regions and announced that a model along these lines would replace jobactive from July 2022.[x] In two significant policy announcements during 2021, the government backed away from key Expert Panel recommendations: Around half of participants in employment assistance received online services during the pandemic From March to September 2020, mutual obligations were suspended due to COVID lockdowns. They were gradually reintroduced from September 2020 to April 2021. People who were newly unemployed and assessed with fewer barriers to employment were referred to an online service (backed by a call centre run by the Department of Education Skills and Employment) rather than jobactive providers. In March 2021, 917,000 people were assisted by jobactive providers and 306,000 received online services.[xiii] [i] Langenbucher K (2015), ‘How demanding are eligibility criteria for unemployment benefits: quantitative indicators for OECD and EU countries’, OECD Social, Employment and Migration Working Paper No. 166, Paris. [ii] ACOSS (2021b), op cit. [iii] Department of Education, Skills and Employment (2021), Response to Question No. SQ21-000491 from Senate Committee on Education and Employment, Budget Estimates 2021 – 2022. [iv] For details of the program, see: https://www.jobs.gov.au/jobactive [v] Jobactive quarterly caseload data: https://lmip.gov.au/default.aspx?LMIP/Downloads/EmploymentRegion; Department of Education Skills and Employment (2021), Response to Senate Estimates Question No. SQ21-000023. [vii] ACOSS (2019), Voices of unemployment. [viii] Department of jobs, skills and small and family business (2018), The next generation of employment services discussion paper, Appendices. [ix] Employment Services Expert Advisory Panel (2019), I want to work. [x] Department of Education Skills and Employment (2020), New Employment Services Model Factsheet. [xi] Morrison S (2021), Morrison Government Commits Record $9B to Social Security Safety Net. Media Release, 23 February 2021, Canberra. [xii] Department of Education, Skills and Employment (2021), Response to Senate Estimates Question No. SQ21-000836. [xiii] Department of Education, Skills and Employment (2021), Response to Senate Estimates Question No. SQ21-000836. Table 1: Major Department of Education Skills and Employment programs – estimated average number of participants and costs The compulsory ‘Annual Activity’ is often the most intensive form of employment assistance, but few received substantial help To assess the intensity of assistance provided to people unemployed long-term in jobactive, we examine the assistance they received during 2019 when undertaking their ‘Annual Activity Requirement’, a compulsory activity which people engaged in for up to six months of every year of unemployment.[i] Table 2 shows that in August 2019, of the 88,600 people engaged in an Annual Activity: Table 2: Participation and employment outcomes from jobactive and ‘annual activities’ (2018-19) Sources: Senate Standing Committee on Education and Employment (2020): Questions on Notice, Supplementary Budget Estimates 2019-2020: Dept of Employment, Skills, Small and Family Business Question No. EMSQ19-001227; Department of Employment, Skills, Small and Family Business (2019): Employment Services Outcomes Report (jobactive), detailed outcome tables for activities undertaken between January and December 2019. Note: ‘Annual activity’ refers to compulsory activities required in each year of unemployment after the first year. [i] Disruption of employment services by the pandemic means that annual activities in 2020 and 2021 are likely to be atypical. Indeed, for much of this period face to face activities were suspended. Around 40-50% of jobactive participants were employed three months later but many of the jobs were not sustained Among all jobactive participants during 2019, 46% obtained employment three months later, and of those jobs 46% were fulltime and 54% part-time. Among those who obtained employment, 54% were in casual positions and 47% were underemployed (seeking more paid hours).[i] This supports our earlier assessment that entry-level jobs are increasingly offered on a part-time and casual basis. Further, many job placements for jobactive participants are with labour hire firms, who are less likely to offer permanent employment.[ii] Table 2 (above) shows that in 2019, 40-50% of participants in compulsory annual activities were in employment three months later, but does not reveal whether the job was sustained. The level of employment outcomes for which providers received outcome payments (which require employment to be sustained for 3- 6 months) was significantly lower: Wage subsidies and training had better outcomes than Work for the Dole Table 2 (above) tells us that during 2019, of the 89,000 people (mostly unemployed long-term) who participated in a jobactive annual activity, 45% were employed three months later. Employment outcomes varied for different activities: These results suggest that wage subsidies and vocational training had greater impact on people’s employment prospects than Work for the Dole or voluntary work. However, they do not take account of other factors that may contribute to those outcomes (for example more older workers may undertake voluntary work). To work out the ‘net impact’ of a program on people’s employment prospects, we need to compare employment among program participants and a similar group (called a ‘control group’) who did not join the program. Evidence from the Department of Jobs and Small Business indicates that: The main reason that wage subsidies are more effective is that people receive direct experience in a regular paid job and are often kept on after the subsidy ends. Work for the Dole activities are further removed from regular employment. Evidence from evaluations of employment programs internationally suggests the most effective programs for people disadvantaged in the labour market include wage subsidies and vocational training (Table 3). Job search assistance makes a difference, but on its own it is not enough to improve the prospects of most people unemployed long-term. People need to apply for jobs in order to get one, but simply applying for more won’t make a difference if employers are reluctant to engage them. Recent experience in regular employment (not ‘make work’ schemes like Work for the Dole), training that improves skills, and engagement with employers to encourage them to consider people they wouldn’t otherwise, are more likely to have an impact. Which of these options works best will vary from person to person, from industry to industry, and from region to region. Table 3: Average impacts of different programs internationally on the employment prospects of unemployed people In view of these findings, the low level of participation in more effective programs and activities in Australia, especially wage subsidies and vocational training, is of concern.[i] Under-investment in these more effective interventions is false economy. [i] The Government recently increased its expenditure on vocational education and training through the Jobtrainer program. This $500 million investment (matched by State governments) is expected to fund around 460,000 additional training places up to December 2022 in free or low-fee courses in areas of identified skills need such as health, aged and disability care, IT and trades. The program is open to unemployed people as well as school-leavers. Unfortunately, detailed data on participation in the program among people on unemployment payments is not available. [i] Department of Employment, Skills, Small and Family Business (2019): Employment Services Outcomes Report – January and December 2019. [ii] Department of jobs skills and small and family business (2018), op cit. [iii] Department of Employment, Skills, Small and Family Business (2019), Responses to Senate Estimates Questions EMSQ19-001224 and EMSQ19-001227. [iv] Department of Education Employment and Workplace Relations (2012), Employment Pathway Fund Wage Subsidies Evaluation Paper. [v] Department of Employment (2016), Work for the Dole 2014-15 Pilot Evaluation. [perfectpullquote align=”full” bordertop=”false” cite=”” link=”” color=”f8e27e” class=”” size=”13″] Job placement and training for people disadvantaged in the labour market: The Brotherhood of St Laurence’s ‘Given a Chance’ program Effective employment programs for people unemployed long-term often combine sustained relationships with employers, then working backwards from the requirements of the job to design a package of supports for unemployed people including training, trial placements (often with effective wage subsidies) and mentoring. Given the Chance has worked with multiple disadvantaged jobseeker groups including refugees, young people, mature aged, Aboriginal and Torres Strait Islander people, people with disability and those who are unemployed long-term. The Brotherhood’s Group Training Organisation provides high-support labour hire services. The Brotherhood acts as the initial employer supporting fixed term paid placements with host businesses, including via traineeships and apprenticeships. This encourages businesses which might not otherwise do so to open up opportunities: it reduces the risks of direct employment; provides flexibility; and enables them to trial recruits before hiring them. In addition, their employment can be counted towards meeting targets laid out by the Victorian Government’s Social Procurement Framework, and the program is backed by its Jobs Victoria Network. Given the Chance establishes a host hire agreement with partner employers and charges an hourly oncost rate for participants hired by BSL who are placed in jobs at the partner’s worksites, based on the Award. The following elements of the program were keys to its success: In the last two financial years, the program placed over 300 people with 43 host employers. Around half of the placements are in apprenticeships and traineeships and half in fixed term labour hire (minimum three months. Programs like Given a Chance are not the answer for everyone who is unemployed long-term, but they are likely to make a real difference. The biggest employer in the program (ANZ) achieved remarkable postplacement employment outcomes: 80% of participants have gone on to other roles within the bank, or to other employment once their original placement concluded. By investing in the main ‘building blocks’ of successful programs such as this (including wage subsidies and training for people unemployed long-term and local partnerships between employment services, employers, and public and community colleges), governments can help scale up this and similar programs across the country.[/perfectpullquote]What help do unemployed people get from government?
3.1 How does Australia compare internationally in its support for people who are unemployed?
3.2 What are unemployed people required to do to receive income support?
3.3 What help do they receive from employment services?
Other employment programs funded by the Australian Government include Disability Employment Services, Community Development Program (for remote Aboriginal and Torres Strait Islander communities), wage subsidies, ParentsNext (for parents with preschool age children), Transition to Work (for young early school-leavers), and Youth Jobs PaTH (for young unemployed people).
‘Employment outcomes three months later’ refers to the proportion employed after each type of activity, whether conducted in the annual activity period or not, and whether or not the activity contributed to that outcome.
Outcomes for wage subsidies refer to employment status three months after commencement of a subsidised job.
n.a. = not applicable, since people usually secured their own part-time employment or voluntary work.
3.4 What does the international evidence about programs to reduce long-term unemployment reveal?
44% are over 45 years of age.
34% have a disability.
55% are women.